Monitoring Disk I/O Metrics with Prometheus and Grafana
Disk IOPS (input/output per second) stats are metrics that gives you insights on how your system interact with your storage devices. These metrics measure read and write operations.
Fundamental Disk IOPS metrics
IOPS (Input/Output Per Second)
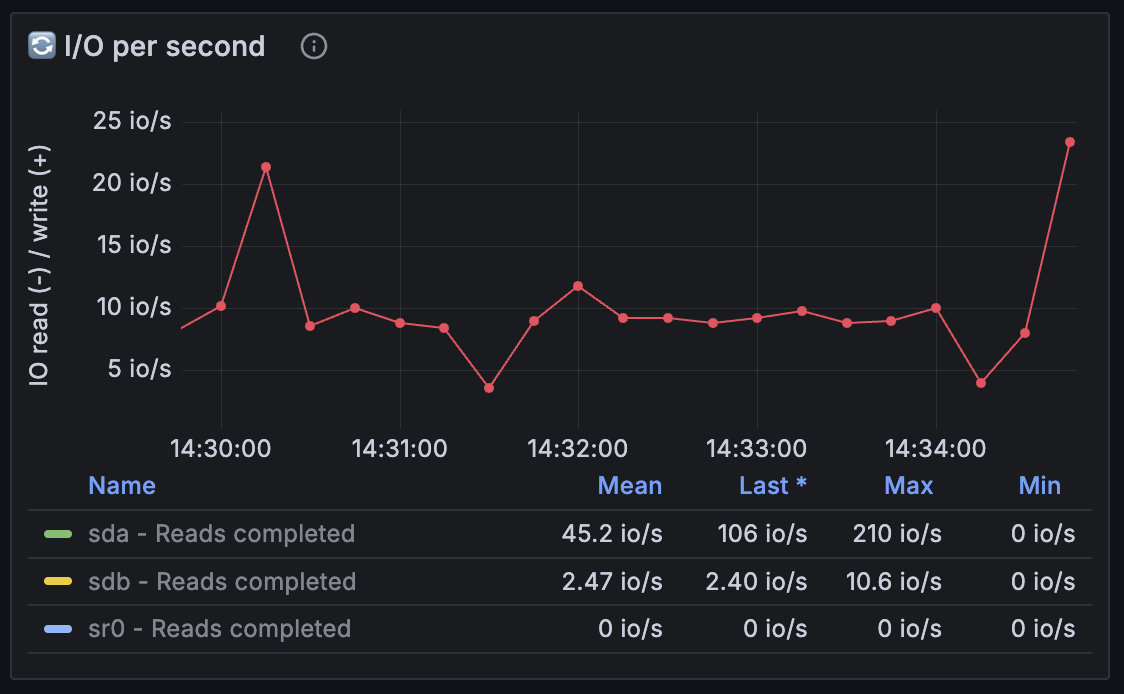
IOPS stats measures how many Input(write)/Output(read) transaction your storage devices perform per second.
IOPS metrics are exported by node exporter.
irate(node_disk_reads_completed_total[$__rate_interval])
irate(node_disk_writes_completed_total[$__rate_interval])
IOPS depends on your disk but a higher number generally mean better performance, but a context matter , IOPS metrics is meaningless without a latencey figure:
- High IOPS but low latency = healthy
- Low IOPS + high latency = disk contention
Latency (Average time per operation)
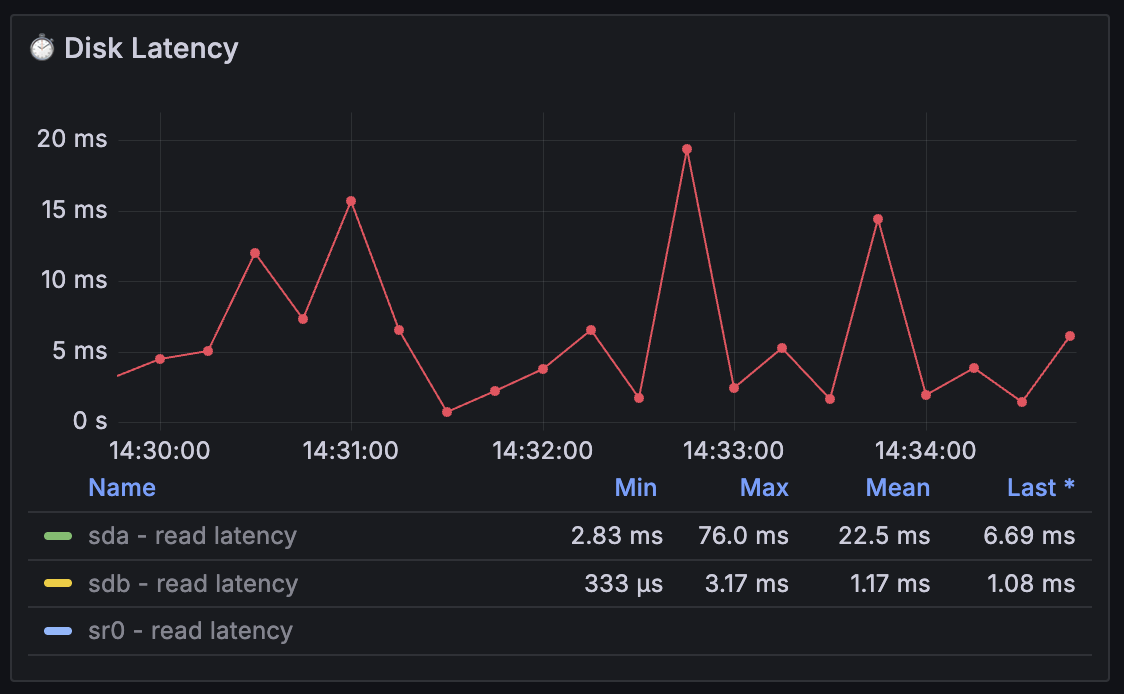
Latency represents the time it takes for the I/O request to be completed.
Latency = Queue time + processing (READ or Write) operation.
Latency is the most important metrics to consider for a storage performance. Lower latency means better performance.
irate(node_disk_write_time_seconds_total[$__rate_interval])/irate(node_disk_writes_completed_total[$__rate_interval]) # Read Latency
irate(node_disk_write_time_seconds_total[$__rate_interval])/irate(node_disk_writes_completed_total[$__rate_interval]) # Write Latency
Utilisation
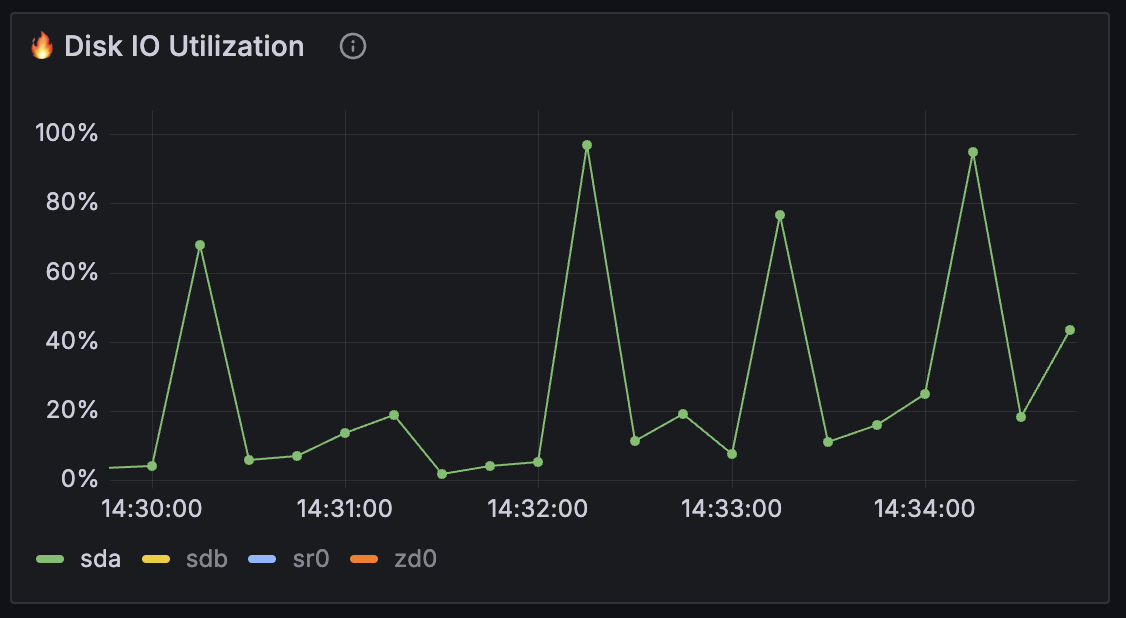
Disk Utilisation is the percentage of time the disk busy processing I/O operations.
High disk I/O time utilisation (e.g: > 80%) means te disk is busy almost all the time handling I/O requests. Technically, it means:
- Slow or failing hardware
- Concurrent access bottlenecks
- High I/O workload
- Insefficient access patterns
If latency is also high, this means the disk can’t keep up , which leads to performance degradation.
rate(node_disk_io_time_seconds_total[1m]) * 100
- High utilization + high latency = saturated disk
Throughput or Bandwidth
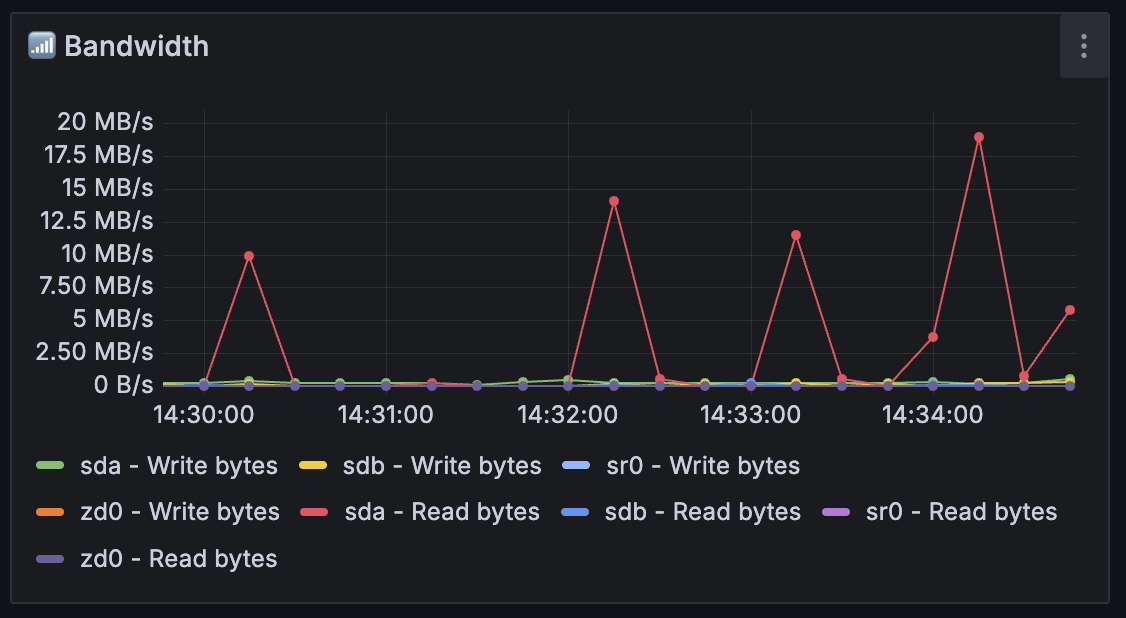
Troughput or Bandwidth represents the amount of data in Megabytes per second (MB/s) transferred to or from the storage device.
irate(node_disk_written_bytes_tota[$__rate_interval])
irate(node_disk_read_bytes_total[$__rate_interval])
Here is how to interpret the bandwidth metrics:
- If your read/write MB/s is close to the specs of your disk, it’s OK.
- If you see very low bandwidth but high I/O wait or high disk utilization, the disk might be overloaded on small random reads (IOPS problem, not bandwidth).
- If both bandwidth and IOPS are high, the disk is at full load.